
PC Bottlenecking: Identify CPU, GPU, RAM and Storage Limits
Use workload-specific measurements to find what is holding performance back—and avoid misleading one-number bottleneck calculators.
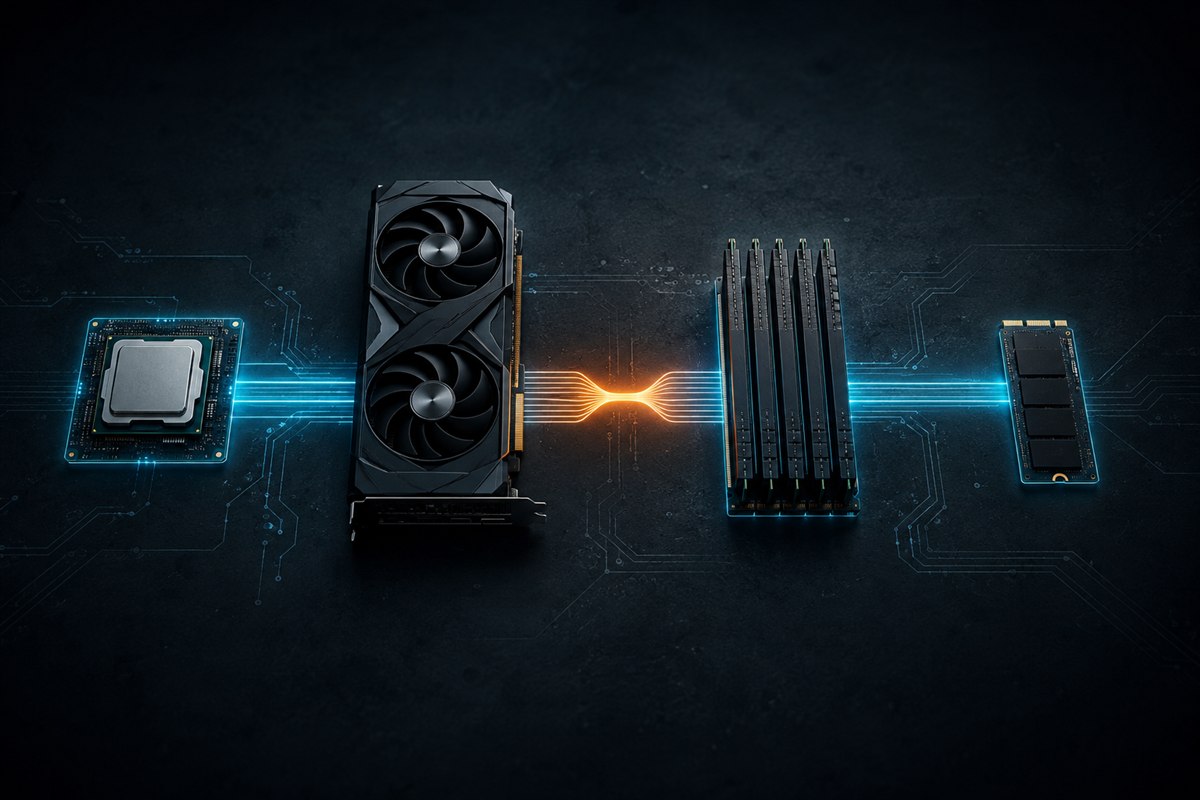
A bottleneck is simply the part of a workflow that currently limits throughput. It is not a permanent label attached to a computer. The same PC can be GPU-limited in one game, CPU-limited in another and storage-limited while copying files.
Start with one slow task
Define the exact symptom: low average FPS, stutter, long exports, slow startup or delayed file access. Reproduce it consistently and monitor utilization, temperatures, clock speed, memory use, disk active time and frame times. Change one variable, repeat the same test and compare.
Online bottleneck calculators reduce complex, changing workloads to a percentage and cannot observe your game scene, settings, software or thermals. Use measured behavior instead.
Recognize CPU and GPU limits
| Observation | Likely direction | Confirmation test |
|---|---|---|
| GPU remains near full use | GPU limit | Lower resolution or render scale |
| One or more CPU threads saturated while GPU use falls | CPU/game-engine limit | Lower CPU-heavy simulation, crowd or view-distance settings |
| Clock speeds fall as temperature or power rises | Thermal/power limit | Compare a cool first run with a sustained run |
Total CPU use can be misleading: a game may saturate a few important threads while the overall percentage looks moderate. Likewise, low GPU use can result from a frame cap, menu screen, driver issue, memory pressure or game limitation rather than the CPU alone.
Identify RAM and VRAM pressure
When system memory fills, Windows may move less-active pages to storage. Heavy paging can cause pauses and slow application switching. Check committed memory as well as the simple use percentage, and close known memory-heavy applications for a comparison.
VRAM pressure can cause texture pop-in, stutter or sharp performance loss. Reduce texture quality, ray-tracing assets or resolution and retest. Shared GPU memory is not equivalent to dedicated VRAM performance. Also confirm modules use the recommended channels and stable settings.
Identify storage and motherboard constraints
High disk active time with low throughput and long response times can indicate many small requests, paging, background scanning or a struggling drive. Compare health information from the drive manufacturer, free space and the application’s access pattern. Back up immediately if a drive reports errors.
A motherboard is rarely a simple FPS bottleneck, but it defines CPU support, memory configuration, expansion lanes and power delivery. A card in a slot with fewer active lanes, a drive sharing lanes, outdated firmware or sustained VRM throttling can constrain performance. Consult the board manual and monitoring data.
Build an evidence-based conclusion
- If lowering resolution greatly raises FPS, graphics performance is the likely limit.
- If lowering resolution changes little, examine CPU threads, frame caps and engine behavior.
- If closing applications removes stutter, investigate memory or background activity.
- If performance falls over time, check temperature, power and clock trends.
- If only one title performs poorly, investigate that game and driver before replacing hardware.
A balanced PC does not mean every component reaches 100% together. It means the machine meets its target in the workloads that matter without an unnecessarily expensive mismatch.
Frequently asked questions
Is 100% GPU usage bad?
Not by itself. In an uncapped graphics-heavy game it often means the GPU is being fully used as intended.
Can a motherboard bottleneck a GPU?
Slot lanes, firmware, power delivery or lane sharing can constrain hardware, but exact impact depends on the platform and workload.
Does every PC have a bottleneck?
Every finite workload has a limiting stage; the goal is meeting your target, not eliminating all limits.